Keep what both images support.
Vessels, waterfront structures, and shore-side buildings appear in both images. These broad observations remain supported; an identical operating function does not follow.
“Flight is not the absence of gravity, but the art of working within its constraints.”
Learning to navigate
fine-grained remote sensing scenes.
From FBA’s scene-transfer question to finer contextual adaptation. Inspired by aerodynamics, G&F brings visual grounding and evidence-based reasoning together.

01 / A changing research question
Our earlier work focused on capability coverage: giving a model the remote-sensing knowledge and skills it needed before specialization. As the backbone grows stronger, our research shifts toward a new question: how can it organize what it already knows to solve more demanding tasks?
Recognizing ships, vehicles, and facilities is a starting point. A useful judgment must select the observations that matter, connect them to the task, and adapt when the local evidence changes. This is the step from FBA to Gravity & Flight.
 Explore figure
FBA's original motivation: acquire the alignment, modality, and task capabilities needed for scenario specialization. This is the earlier work's framing, illustrated with a harbor report.
Original PDF Explore figure
An illustrative harbor case: recognizing ships and facilities does not by itself resolve vehicle-staging suitability. The G&F response connects vehicle rows, paved space, and nearby berths to the task. Both waterfronts are in one input image.
Original PDF
Knowing what is there is the beginning.
Knowing what matters is the next step.
The connection to FBA
Filling Before Advancing (FBA) prepares the capabilities needed for scenario specialization. Its second stage, Bridging-Conv, learns shared priors from target and related bridging scenes. This scene-transfer idea is the starting point for G&F.
We bring the transfer question inside a scene domain: when two images belong to the same broad category, how should judgments adapt to changes in local attributes, spatial relations, or visibility? G&F studies these fine-grained contexts under a shared task.
 Explore figure
FBA's three-stage training design. Stage 2 learns shared priors from target and related bridging scenes; this transfer idea later motivated G&F's focus on contextual variations within one scene domain.
Original PDF Explore figure
Two stages connect careful observation to contextual reasoning: EoT-SFT establishes the process, and RTPO refines it through feedback on task-matched image pairs. Inference uses one image.
Original PDFTwo distinct harbor images, one shared question. Each image is answered independently; their local evidence determines what the judgments should preserve, change, or leave less specific.
How are the vessels positioned relative to the waterfront?
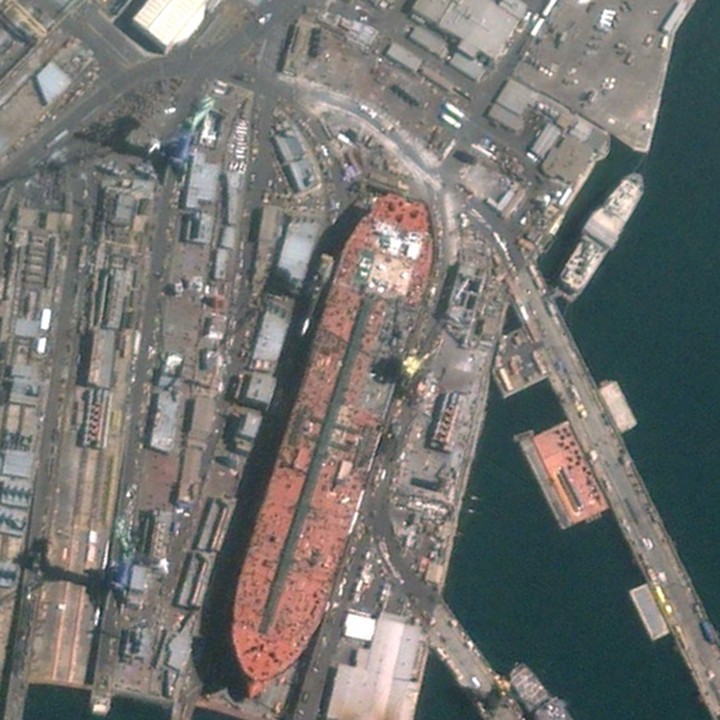
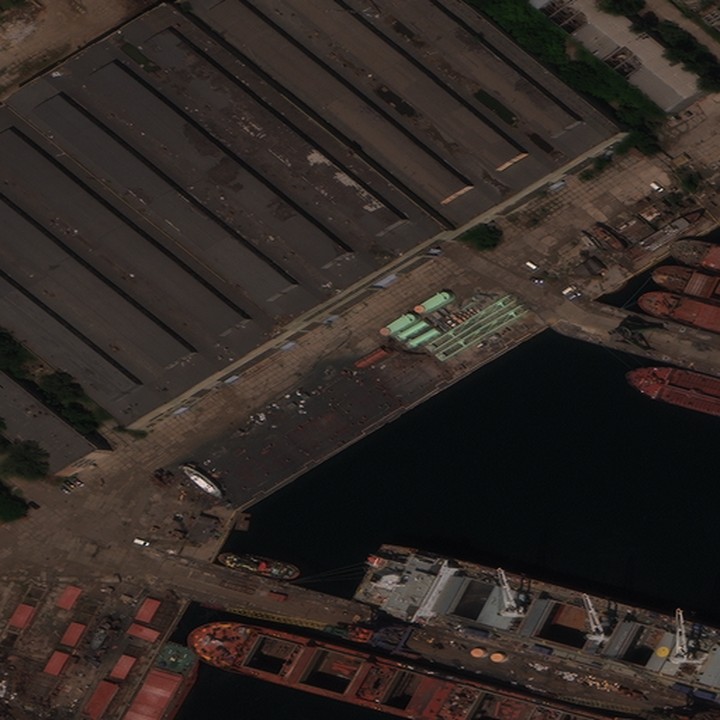
Vessels, waterfront structures, and shore-side buildings appear in both images. These broad observations remain supported; an identical operating function does not follow.
In A, the vessel sits inside a narrow enclosure. In B, vessels lie along a more open basin. The spatial description should change with the local evidence.
These views alone do not establish active repair, facility throughput, or operational intensity. Describe the visible structure while leaving unsupported activity uncertain.
Illustrative reading of the repository images. These descriptions are not model outputs or benchmark results.
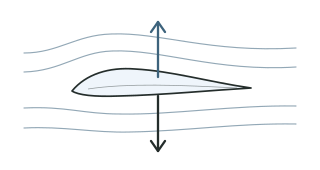
From gravity and lift to visual grounding and reasoning: a physical intuition becomes two complementary verification views.
 LiftWeight
The design draws inspiration from the interplay of gravity and aerodynamic lift. Gravity anchors visual claims to the image; Flight evaluates how reasoning develops from those observations and adapts across task-matched contexts.
The sketch expresses the naming metaphor. Its arrows do not encode reward weights.
“Does the image support what was said?”
“Does the reasoning follow from the description?”
Flight accepts described premises conditionally. It does not inspect images or Evidence Cards. Gravity checks visual truth; a separate Task Check assesses final answers.
Read the framework from top to bottom: supervised initialization, then relational policy optimization.
First, learn to observe, reason, and answer. Then refine those judgments across related contexts. Training uses image pairs; inference needs only one image.
Harbor specialization on six evaluation sets. Each benchmark keeps its own scoring protocol; Overall is their unweighted mean on a 0–100 scale.
+9.76points over Base
+4.56points over EoT-SFT
Score / 100 · higher is better
Overall: reported means from Tables 1–2. Per-benchmark views compare Base and G&F Stage 1 breakdowns are not reported.
Scroll horizontally to compare all six sets
| Model | HarborEval | VRSBench | RSVQA | OpenEval | OmniEarth | VLRS-Bench | Overall |
|---|---|---|---|---|---|---|---|
| Qwen3.5-4B | 73.15 | 37.21 | 58.69 | 67.34 | 80.39 | 39.39 | 59.36 |
| RS-EoT | 74.54 | 31.86 | 63.98 | 58.19 | 67.34 | 41.67 | 56.26 |
| RSThinker | 69.06 | 67.67 | 50.07 | 42.53 | 66.33 | 34.47 | 55.02 |
| G&F | 82.57 | 54.19 | 67.18 | 82.07 | 80.99 | 47.73 | 69.12 |
G&F improves over its backbone on every reported harbor set. RSThinker retains the higher VRSBench score. These are harbor subsets, not full-benchmark rankings.
Paired RL without F2 reaches 66.79, compared with 65.12 for single-image RL. Full G&F reaches 69.12; shuffling F2 feedback within each training unit gives 64.71.
A separate urban model is trained through both stages using 160 demonstrations and 60 training pairs, retaining the harbor rubric dimensions and reward weights.
Points over urban Stage 1 on fixed subsets; this is separate urban specialization, not zero-shot transfer of the harbor model.
| Setting | Overall | Measured relative training time |
|---|---|---|
| Base | 59.36 | — |
| EoT-SFT | 64.56 | 1.00× |
| Without Gravity & Flight | 63.34 | 8.15× |
| Without Flight | 65.11 | 10.13× |
| Without Gravity | 66.32 | 15.83× |
| Single-image RL | 65.12 | 13.38× |
| Paired RL without F2 | 66.79 | 13.57× |
| Shuffled F2 feedback | 64.71 | 17.20× |
| Joint-input RL | 66.49 | 16.86× |
| Full G&F | 69.12 | 16.69× |
End-to-end wall time includes Stage 1 and verifier waiting, normalized to Stage 1 = 1.00× on the same two-GPU machine. One run per setting; small time differences can reflect run-to-run variation.
The shuffled control keeps the image pairs intact and permutes computed F2 scores among the six candidate pairs within each training unit. It tests feedback alignment.
| Dimension | Items | Within one point of humans (%) | Repeat-change rate (%) |
|---|---|---|---|
| G1 | 48 | 91.67 | 22.92 |
| G2 | 48 | 100.00 | 12.50 |
| F1 | 48 | 89.58 | 27.08 |
| F2 | 24 | 83.33 | 29.17 |
24 sampled training units; two independent annotators with adjudication. Agreement compares the first judge call with the human reference. Repeat-change counts any score difference across two identical calls. This small audit indicates reliability; it does not validate the rubric itself.
A token-level analysis of six randomly sampled image–question cases compares Base and G&F responses to the same inputs.
Mean task-related content density
Mean task-related content density
A descriptive analysis of six cases, not a benchmark-wide efficiency or accuracy estimate. Density is the mean per-response task-related content proportion; full-response length includes format tokens.
Response analysis · Scope & statistics ↗Method, reported results & study scope
Website source & project documentation
Model card available · weights planned after paper acceptance
Stage 1 and Stage 2 · three examples each
Manuscript, training code, models & data
Model weights and the full dataset are planned for staged release after paper acceptance. The dataset page currently provides three Stage-1 demonstrations and three Stage-2 image pairs.